Log Analytics

Azure Arc Connected K8s Billing usage workbook error - 'union' operator: Failed to resolve table expression named 'ContainerLogV2'

Using ‘Container Insights’ for Kubernetes can get expensive, I recently saw a customer creating 19TB of logs a month from logging container insights from an AKS cluster.

You may want to check what logs you are capturing as suggested through Microsoft guides Monitoring cost for Container insights - Azure Monitor | Microsoft Docs which suggests one of the first steps to check billing usage.

As of writing this if you enable container insights and try to view Data Usage you get an error. ‘union' operator: Failed to resolve table expression named 'ContainerLogV2’. ContainerLogV2 is in preview or if you are just aren’t ready to deploy that, here is how to fix the report manually. I also have included the Full report at the end.

However, depending on when you deploy this and how you deployed insight metrics you may hit this error.

As of writing this, ContainerLogV2 is in preview and you can follow this guide to deploy it. Configure the ContainerLogV2 schema (preview) for Container Insights - Azure Monitor | Microsoft Docs. If you want to gain some quick insight into your usage you can edit the workbook. We just need to get through the maze of edits to get to the underlying query.

  • Select ‘Azure Arc’ services

  • select ‘Kubernetes clusters’ under infrastructure

  • select your K8s cluster

  • select ‘Workbooks’ under Monitoring

  • select ‘Container Insights Usage’ workbook

  • you can either edit this one or ‘Save As’ and create a new name. I will create a copy.

Open your chosen workbook

you can now edit the group item.

by Namespace

Editing the Namespace selection Dropdown parameter query

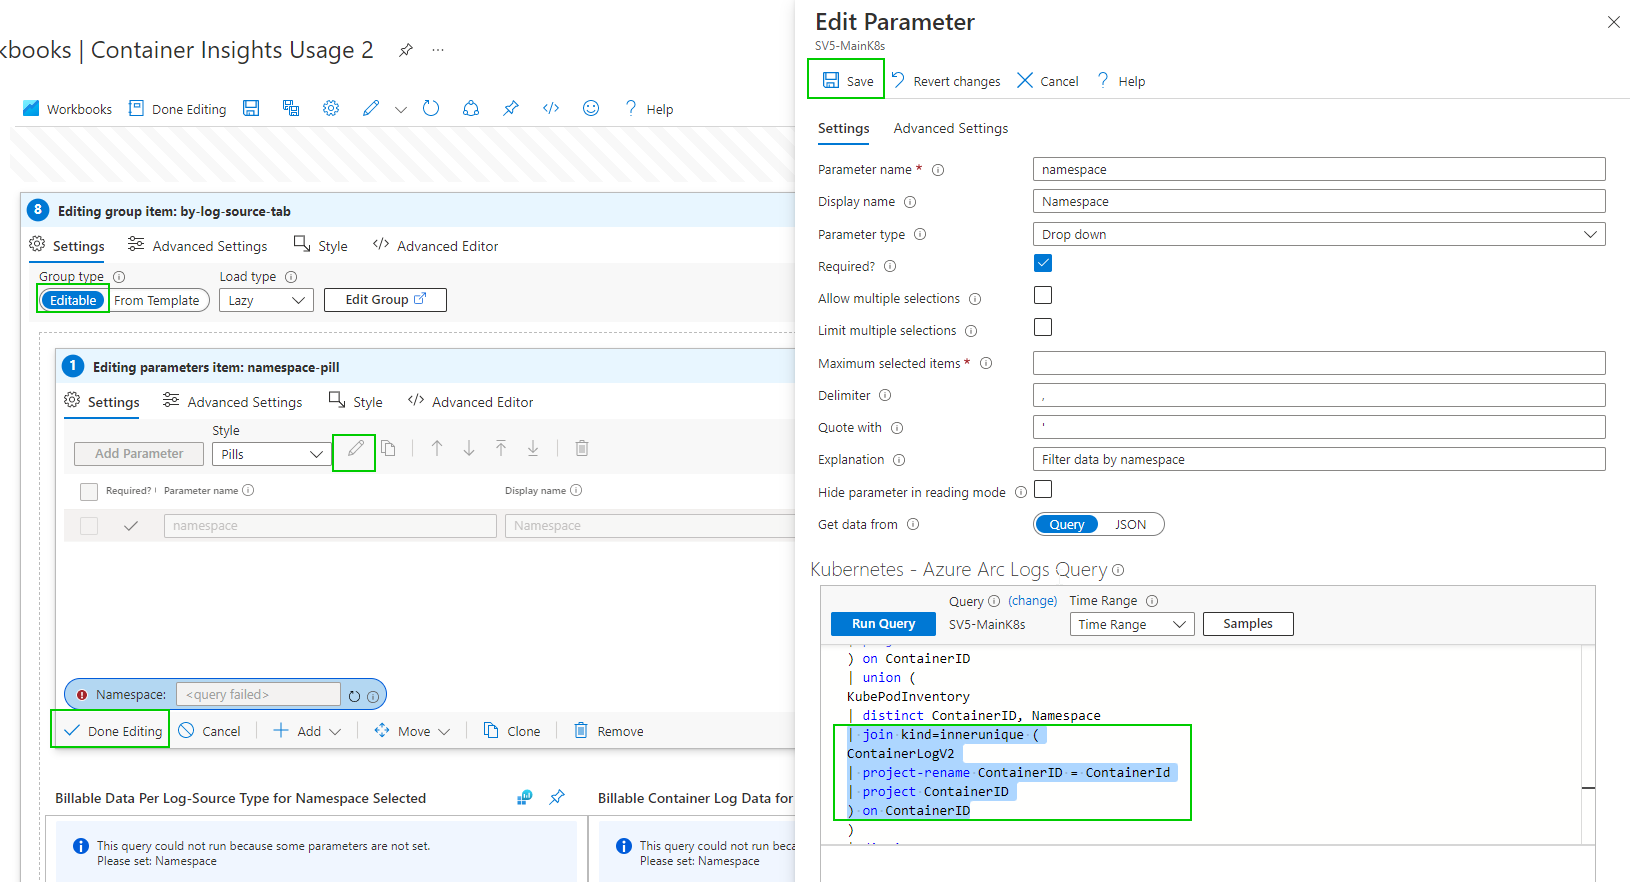
Hopefully, you get the gist of the process. There are a few more queries to edit.

And

This will now work for Data Usage. This is likely a temporary solution until ContainerLogV2 comes out of preview. Configure the ContainerLogV2 schema (preview) for Container Insights - Azure Monitor | Microsoft Docs

Gallery Template code

{
  "version": "Notebook/1.0",
  "items": [
    {
      "type": 9,
      "content": {
        "version": "KqlParameterItem/1.0",
        "crossComponentResources": [
          "{resource}"
        ],
        "parameters": [
          {
            "id": "670aac26-0ffe-4f29-81c2-d48911bc64b6",
            "version": "KqlParameterItem/1.0",
            "name": "timeRange",
            "label": "Time Range",
            "type": 4,
            "description": "Select time-range for data selection",
            "isRequired": true,
            "value": {
              "durationMs": 21600000
            },
            "typeSettings": {
              "selectableValues": [
                {
                  "durationMs": 300000
                },
                {
                  "durationMs": 900000
                },
                {
                  "durationMs": 3600000
                },
                {
                  "durationMs": 14400000
                },
                {
                  "durationMs": 43200000
                },
                {
                  "durationMs": 86400000
                },
                {
                  "durationMs": 172800000
                },
                {
                  "durationMs": 259200000
                },
                {
                  "durationMs": 604800000
                },
                {
                  "durationMs": 1209600000
                },
                {
                  "durationMs": 2419200000
                },
                {
                  "durationMs": 2592000000
                },
                {
                  "durationMs": 5184000000
                },
                {
                  "durationMs": 7776000000
                }
              ],
              "allowCustom": true
            }
          },
          {
            "id": "bfc96857-81df-4f0d-b958-81f96d28ddeb",
            "version": "KqlParameterItem/1.0",
            "name": "resource",
            "type": 5,
            "isRequired": true,
            "isHiddenWhenLocked": true,
            "typeSettings": {
              "additionalResourceOptions": [
                "value::1"
              ],
              "showDefault": false
            },
            "timeContext": {
              "durationMs": 21600000
            },
            "timeContextFromParameter": "timeRange",
            "defaultValue": "value::1"
          },
          {
            "id": "8d48ec94-fde6-487c-98bf-f1295f5d8b81",
            "version": "KqlParameterItem/1.0",
            "name": "resourceType",
            "type": 7,
            "description": "Resource type of resource",
            "isRequired": true,
            "query": "{\"version\":\"1.0.0\",\"content\":\"\\\"{resource:resourcetype}\\\"\",\"transformers\":null}",
            "isHiddenWhenLocked": true,
            "typeSettings": {
              "additionalResourceOptions": [
                "value::1"
              ],
              "showDefault": false
            },
            "timeContext": {
              "durationMs": 21600000
            },
            "timeContextFromParameter": "timeRange",
            "defaultValue": "value::1",
            "queryType": 8
          },
          {
            "id": "1b826776-ab99-45ab-86db-cced05e8b36d",
            "version": "KqlParameterItem/1.0",
            "name": "clusterId",
            "type": 1,
            "description": "Used to identify the cluster name when the cluster type is AKS Engine",
            "isHiddenWhenLocked": true,
            "timeContext": {
              "durationMs": 0
            },
            "timeContextFromParameter": "timeRange"
          },
          {
            "id": "67227c35-eab8-4518-9212-1c3c3d564b20",
            "version": "KqlParameterItem/1.0",
            "name": "masterNodeExists",
            "type": 1,
            "query": "let MissingTable = view () { print isMissing=1 };\r\nlet masterNodeExists = toscalar(\r\nunion isfuzzy=true MissingTable, (\r\nAzureDiagnostics \r\n| getschema \r\n| summarize c=count() \r\n| project isMissing=iff(c > 0, 0, 1)\r\n) \r\n| top 1 by isMissing asc\r\n);\r\nprint(iif(masterNodeExists == 0, 'yes', 'no'))\r\n",
            "crossComponentResources": [
              "{resource}"
            ],
            "isHiddenWhenLocked": true,
            "timeContext": {
              "durationMs": 0
            },
            "timeContextFromParameter": "timeRange",
            "queryType": 0,
            "resourceType": "{resourceType}"
          }
        ],
        "style": "pills",
        "queryType": 0,
        "resourceType": "{resourceType}"
      },
      "name": "pills"
    },
    {
      "type": 1,
      "content": {
        "json": "Please note that the Container Insights Usage workbook for AKS Engine clusters shows your billable data usage for your cluster's entire workspace ({resource:name}), and not just the cluster itself ({clusterId}). ",
        "style": "info"
      },
      "conditionalVisibility": {
        "parameterName": "resourceType",
        "comparison": "isEqualTo",
        "value": "microsoft.operationalinsights/workspaces"
      },
      "name": "aks-engine-billable-data-shown-applies-to-entire-workspace-not-just-the-cluster-info-message",
      "styleSettings": {
        "showBorder": true
      }
    },
    {
      "type": 11,
      "content": {
        "version": "LinkItem/1.0",
        "style": "tabs",
        "links": [
          {
            "id": "3b7d39f2-38c5-4586-a155-71e28e333020",
            "cellValue": "selectedTab",
            "linkTarget": "parameter",
            "linkLabel": "Overview",
            "subTarget": "overview",
            "style": "link"
          },
          {
            "id": "7163b764-7ab2-48b3-b417-41af3eea7ef0",
            "cellValue": "selectedTab",
            "linkTarget": "parameter",
            "linkLabel": "By Table",
            "subTarget": "table",
            "style": "link"
          },
          {
            "id": "960bbeea-357f-4c07-bdd9-6f3f123d56fd",
            "cellValue": "selectedTab",
            "linkTarget": "parameter",
            "linkLabel": "By Namespace",
            "subTarget": "namespace",
            "style": "link"
          },
          {
            "id": "7fbcc5bd-62d6-4aeb-b55e-7b1fab65716a",
            "cellValue": "selectedTab",
            "linkTarget": "parameter",
            "linkLabel": "By Log Source",
            "subTarget": "logSource",
            "style": "link"
          },
          {
            "id": "3434a63b-f3d5-4c11-9620-1e731983041c",
            "cellValue": "selectedTab",
            "linkTarget": "parameter",
            "linkLabel": "By Diagnostic Master Node ",
            "subTarget": "diagnosticMasterNode",
            "style": "link"
          }
        ]
      },
      "name": "tabs"
    },
    {
      "type": 1,
      "content": {
        "json": "Due to querying limitation on Basic Logs, if you are using Basic Logs, this workbook provides partial data on your container log usage.",
        "style": "info"
      },
      "conditionalVisibility": {
        "parameterName": "selectedTab",
        "comparison": "isEqualTo",
        "value": "overview"
      },
      "name": "basic-logs-info-text"
    },
    {
      "type": 12,
      "content": {
        "version": "NotebookGroup/1.0",
        "groupType": "editable",
        "title": "Container Insights Billing Usage",
        "items": [
          {
            "type": 1,
            "content": {
              "json": "<br/>\r\nThis workbook provides you a summary and source for billable data collected by [Container Insights solution.](https://docs.microsoft.com/en-us/azure/azure-monitor/insights/container-insights-overview)\r\n\r\nThe best way to understand how Container Insights ingests data in Log Analytics workspace is from this [article.](https://medium.com/microsoftazure/azure-monitor-for-containers-optimizing-data-collection-settings-for-cost-ce6f848aca32)\r\n\r\nIn this workbook you can:\r\n\r\n* View billable data ingested by **solution**.\r\n* View billable data ingested by **Container logs (application logs)**\r\n* View billable container logs data ingested segregated by **Kubernetes namespace**\r\n* View billable container logs data ingested segregated by **Cluster name**\r\n* View billable container log data ingested by **logsource entry**\r\n* View billable diagnostic data ingested by **diagnostic master node logs**\r\n\r\nYou can fine tune and control logging by turning off logging on the above mentioned vectors. [Learn how to fine-tune logging](https://docs.microsoft.com/en-us/azure/azure-monitor/insights/container-insights-agent-config)\r\n\r\nYou can control your master node's logs by updating diagnostic settings. [Learn how to update diagnostic settings](https://docs.microsoft.com/en-us/azure/aks/view-master-logs)"
            },
            "name": "workbooks-explanation-text"
          },
          {
            "type": 1,
            "content": {
              "json": "`Master node logs` are not enabled. [Learn how to enable](https://docs.microsoft.com/en-us/azure/aks/view-master-logs)"
            },
            "conditionalVisibility": {
              "parameterName": "masterNodeExists",
              "comparison": "isEqualTo",
              "value": "no"
            },
            "name": "master-node-logs-are-not-enabled-msg"
          }
        ]
      },
      "conditionalVisibility": {
        "parameterName": "selectedTab",
        "comparison": "isEqualTo",
        "value": "overview"
      },
      "name": "workbook-explanation"
    },
    {
      "type": 12,
      "content": {
        "version": "NotebookGroup/1.0",
        "groupType": "editable",
        "items": [
          {
            "type": 3,
            "content": {
              "version": "KqlItem/1.0",
              "query": "union withsource = SourceTable AzureDiagnostics, AzureActivity, AzureMetrics, ContainerLog, Perf, KubePodInventory, ContainerInventory, InsightsMetrics, KubeEvents, KubeServices, KubeNodeInventory, ContainerNodeInventory, KubeMonAgentEvents, ContainerServiceLog, Heartbeat, KubeHealth, ContainerImageInventory\r\n| where _IsBillable == true\r\n| project _BilledSize, TimeGenerated, SourceTable\r\n| summarize BillableDataBytes = sum(_BilledSize) by bin(TimeGenerated, {timeRange:grain}), SourceTable\r\n| render piechart\r\n\r\n\r\n",
              "size": 3,
              "showAnnotations": true,
              "showAnalytics": true,
              "title": "Billable Data from Container Insights",
              "timeContextFromParameter": "timeRange",
              "queryType": 0,
              "resourceType": "{resourceType}",
              "crossComponentResources": [
                "{resource}"
              ],
              "chartSettings": {
                "xAxis": "TimeGenerated",
                "createOtherGroup": 100,
                "seriesLabelSettings": [
                  {
                    "seriesName": "LogManagement",
                    "label": "LogManagementSolution(GB)"
                  },
                  {
                    "seriesName": "ContainerInsights",
                    "label": "ContainerInsightsSolution(GB)"
                  }
                ],
                "ySettings": {
                  "numberFormatSettings": {
                    "unit": 2,
                    "options": {
                      "style": "decimal"
                    }
                  }
                }
              }
            },
            "customWidth": "50",
            "showPin": true,
            "name": "billable-data-from-ci"
          }
        ]
      },
      "conditionalVisibility": {
        "parameterName": "selectedTab",
        "comparison": "isEqualTo",
        "value": "table"
      },
      "name": "by-datatable-tab"
    },
    {
      "type": 12,
      "content": {
        "version": "NotebookGroup/1.0",
        "groupType": "editable",
        "items": [
          {
            "type": 3,
            "content": {
              "version": "KqlItem/1.0",
              "query": "KubePodInventory\r\n| distinct ContainerID, Namespace\r\n| join kind=innerunique (\r\nContainerLog\r\n| where _IsBillable == true\r\n| summarize BillableDataBytes = sum(_BilledSize) by ContainerID\r\n) on ContainerID\r\n| union (\r\nKubePodInventory\r\n| distinct ContainerID, Namespace\r\n)\r\n| summarize Total=sum(BillableDataBytes) by Namespace\r\n| render piechart\r\n",
              "size": 3,
              "showAnalytics": true,
              "title": "Billable Container Log Data Per Namespace",
              "timeContextFromParameter": "timeRange",
              "queryType": 0,
              "resourceType": "{resourceType}",
              "crossComponentResources": [
                "{resource}"
              ],
              "tileSettings": {
                "showBorder": false,
                "titleContent": {
                  "columnMatch": "Namespace",
                  "formatter": 1
                },
                "leftContent": {
                  "columnMatch": "Total",
                  "formatter": 12,
                  "formatOptions": {
                    "palette": "auto"
                  },
                  "numberFormat": {
                    "unit": 17,
                    "options": {
                      "maximumSignificantDigits": 3,
                      "maximumFractionDigits": 2
                    }
                  }
                }
              },
              "graphSettings": {
                "type": 0,
                "topContent": {
                  "columnMatch": "Namespace",
                  "formatter": 1
                },
                "centerContent": {
                  "columnMatch": "Total",
                  "formatter": 1,
                  "numberFormat": {
                    "unit": 17,
                    "options": {
                      "maximumSignificantDigits": 3,
                      "maximumFractionDigits": 2
                    }
                  }
                }
              },
              "chartSettings": {
                "createOtherGroup": 100,
                "ySettings": {
                  "numberFormatSettings": {
                    "unit": 2,
                    "options": {
                      "style": "decimal"
                    }
                  }
                }
              }
            },
            "name": "billable-data-per-namespace"
          }
        ]
      },
      "conditionalVisibility": {
        "parameterName": "selectedTab",
        "comparison": "isEqualTo",
        "value": "namespace"
      },
      "name": "by-namespace-tab"
    },
    {
      "type": 12,
      "content": {
        "version": "NotebookGroup/1.0",
        "groupType": "editable",
        "items": [
          {
            "type": 9,
            "content": {
              "version": "KqlParameterItem/1.0",
              "crossComponentResources": [
                "{resource}"
              ],
              "parameters": [
                {
                  "id": "d5701caa-0486-4e6f-adad-6fa5b8496a7d",
                  "version": "KqlParameterItem/1.0",
                  "name": "namespace",
                  "label": "Namespace",
                  "type": 2,
                  "description": "Filter data by namespace",
                  "isRequired": true,
                  "query": "KubePodInventory\r\n| distinct ContainerID, Namespace\r\n| join kind=innerunique (\r\nContainerLog\r\n| project ContainerID\r\n) on ContainerID\r\n| union (\r\nKubePodInventory\r\n| distinct ContainerID, Namespace\r\n)\r\n| distinct Namespace\r\n| project value = Namespace, label = Namespace, selected = false\r\n| sort by label asc",
                  "crossComponentResources": [
                    "{resource}"
                  ],
                  "typeSettings": {
                    "additionalResourceOptions": [
                      "value::1"
                    ],
                    "showDefault": false
                  },
                  "timeContext": {
                    "durationMs": 0
                  },
                  "timeContextFromParameter": "timeRange",
                  "defaultValue": "value::1",
                  "queryType": 0,
                  "resourceType": "{resourceType}"
                }
              ],
              "style": "pills",
              "queryType": 0,
              "resourceType": "{resourceType}"
            },
            "name": "namespace-pill"
          },
          {
            "type": 3,
            "content": {
              "version": "KqlItem/1.0",
              "query": "KubePodInventory\r\n| where Namespace == '{namespace}'\r\n| distinct ContainerID, Namespace\r\n| join hint.strategy=shuffle (\r\nContainerLog\r\n| where _IsBillable == true\r\n| summarize BillableDataBytes = sum(_BilledSize) by LogEntrySource, ContainerID\r\n) on ContainerID\r\n| union (\r\nKubePodInventory\r\n| where Namespace == '{namespace}'\r\n| distinct ContainerID, Namespace\r\n)\r\n| extend sourceNamespace = strcat(LogEntrySource, \"/\", Namespace)\r\n| summarize Total=sum(BillableDataBytes) by sourceNamespace\r\n| render piechart",
              "size": 0,
              "showAnnotations": true,
              "showAnalytics": true,
              "title": "Billable Data Per Log-Source Type for Namespace Selected",
              "timeContextFromParameter": "timeRange",
              "queryType": 0,
              "resourceType": "{resourceType}",
              "crossComponentResources": [
                "{resource}"
              ],
              "chartSettings": {
                "createOtherGroup": 100,
                "ySettings": {
                  "numberFormatSettings": {
                    "unit": 2,
                    "options": {
                      "style": "decimal"
                    }
                  }
                }
              }
            },
            "customWidth": "35",
            "showPin": true,
            "name": "billable-data-per-log-source",
            "styleSettings": {
              "showBorder": true
            }
          },
          {
            "type": 3,
            "content": {
              "version": "KqlItem/1.0",
              "query": "KubePodInventory\r\n| where Namespace == '{namespace}'\r\n| distinct ContainerID, Namespace\r\n| project ContainerID\r\n| join hint.strategy=shuffle ( \r\nContainerLog\r\n| project _BilledSize, ContainerID, TimeGenerated, LogEntrySource\r\n) on ContainerID\r\n| union (\r\nKubePodInventory\r\n| where Namespace == '{namespace}'\r\n| distinct ContainerID, Namespace\r\n| project ContainerID\r\n)\r\n| summarize ContainerLogData = sum(_BilledSize) by bin(TimeGenerated, {timeRange:grain}), LogEntrySource\r\n| render linechart\r\n\r\n",
              "size": 0,
              "showAnnotations": true,
              "showAnalytics": true,
              "title": "Billable Container Log Data for Namespace Selected",
              "timeContextFromParameter": "timeRange",
              "queryType": 0,
              "resourceType": "{resourceType}",
              "crossComponentResources": [
                "{resource}"
              ],
              "chartSettings": {
                "xSettings": {},
                "ySettings": {
                  "numberFormatSettings": {
                    "unit": 2,
                    "options": {
                      "style": "decimal"
                    }
                  }
                }
              }
            },
            "customWidth": "65",
            "conditionalVisibility": {
              "parameterName": "namespace:label",
              "comparison": "isNotEqualTo",
              "value": "<unset>"
            },
            "showPin": true,
            "name": "billable-container-log-data-for-namespace-selected",
            "styleSettings": {
              "showBorder": true
            }
          }
        ]
      },
      "conditionalVisibility": {
        "parameterName": "selectedTab",
        "comparison": "isEqualTo",
        "value": "logSource"
      },
      "name": "by-log-source-tab"
    },
    {
      "type": 12,
      "content": {
        "version": "NotebookGroup/1.0",
        "groupType": "editable",
        "items": [
          {
            "type": 1,
            "content": {
              "json": "`Master node logs` are not enabled. [Learn how to enable](https://docs.microsoft.com/en-us/azure/aks/view-master-logs)"
            },
            "conditionalVisibility": {
              "parameterName": "masterNodeExists",
              "comparison": "isEqualTo",
              "value": "no"
            },
            "name": "master-node-logs-are-not-enabled-msg-under-masternode-tab"
          },
          {
            "type": 3,
            "content": {
              "version": "KqlItem/1.0",
              "query": "AzureDiagnostics\r\n| summarize Total=sum(_BilledSize) by bin(TimeGenerated, {timeRange:grain}), Category\r\n| render barchart\r\n\r\n\r\n",
              "size": 0,
              "showAnnotations": true,
              "showAnalytics": true,
              "title": "Billable Diagnostic Master Node Log Data",
              "timeContextFromParameter": "timeRange",
              "queryType": 0,
              "resourceType": "{resourceType}",
              "crossComponentResources": [
                "{resource}"
              ],
              "chartSettings": {
                "ySettings": {
                  "unit": 2,
                  "min": null,
                  "max": null
                }
              }
            },
            "customWidth": "75",
            "conditionalVisibility": {
              "parameterName": "masterNodeExists",
              "comparison": "isEqualTo",
              "value": "yes"
            },
            "showPin": true,
            "name": "billable-data-from-diagnostic-master-node-logs"
          }
        ]
      },
      "conditionalVisibility": {
        "parameterName": "selectedTab",
        "comparison": "isEqualTo",
        "value": "diagnosticMasterNode"
      },
      "name": "by-diagnostic-master-node-tab"
    }
  ],
  "fallbackResourceIds": [
    "/subscriptions/357e7522-d1ad-433c-9545-7d8b8d72d61a/resourceGroups/ArcResources/providers/Microsoft.Kubernetes/connectedClusters/sv5-k8sdemo"
  ],
  "fromTemplateId": "community-Workbooks/AKS/Billing Usage Divided",
  "$schema": "https://github.com/Microsoft/Application-Insights-Workbooks/blob/master/schema/workbook.json"
}

Fixing Azure Firewall Monitor Workbook

TLDR; Here’s a version of The Azure Firewall Workbook that I fixed: https://github.com/dmc-tech/az-workbooks :)

For a client project, I had to deploy an Azure Firewall and I want to ease the monitoring burden, so I deployed the Azure Monitor workbook as per the article here.

The article has a link to a Workbook that can be deployed to your Azure subscription, and is a great resource giving you plenty of insight into what activity has been taking place on the firewall, via a Log Analytics Workspace configured as part of the diagnostics settings for the resource.

However, I did notice that some of the queries didn’t work as expected and produced some interesting results for the Application rule log statistics.

Below is an example:

If you check out the Action column, you can see that it has quite a lot of information, where I would expect to see ‘Allow’ or ‘Deny’.

I also noticed that some of the other panes did not return any results (such as above), when I expected to see data, so I dug a little deeper, having not really had experience of editing Workbooks.

First of all, I had to check the underlying query, so had to go into ‘edit’ mode.

Once in edit mode, I selected one of the panels that was affected by the faulty query (anything concerning ‘Allow’ for Application Log. Click on the ‘Edit’ button.

We’re concerned with checking the logic and parsing the log, so that the Action is correctly represented, plus the Policy and Rule Collection are populated.

To help triage. I opened the query in the Logs view.

I’ve highlighted where the issues were. First, the logic was incorrect, so the query above was matched, and that did not parse the msg_s field correctly. Second, the parse missed out the ‘space’ for Policy and Rule Collection Group, so would capture incorrectly.

Here’s how the query should look:

Add and msg_s !has “Rule Collection Group as indicated; remove the highlighted and msgs_s !has “Rule Collection , and add spaces as indicated to the parse statement correctly attributes the values to the parameter.

You can see in the query results that the Allow entries no longer have the additional Policy:… text added.

Now that we’ve identify the issue, we need to update the Workbook.

Go back to the workbook end edit the query, putting the identified fixes in place.

Remember to click ‘Done Editing’ when you’re finished.

Here’s a snippet of the query:

(
materializedData
| where msg_s !has "Web Category:" and  msg_s !has ". Url" and msg_s !has  "TLS extension was missing" and msg_s !has "No rule matched" and msg_s !has "Rule Collection Group"
| parse msg_s with Protocol " request from " SourceIP ":" SourcePort " to " FQDN ":" DestinationPort ". Action: " Action ". Rule Collection: " RuleCollection ". Rule: " Rule
),
(
materializedData
| where msg_s !has "Web Category:" and  msg_s !has ". Url" and msg_s !has " Reason: "
| where msg_s has "Rule Collection Group"
| parse msg_s with Protocol " request from " SourceIP ":" SourcePort " to " FQDN ":" DestinationPort ". Action: " Action ". Policy: " Policy ". Rule Collection Group: " RuleCollectionGroup ". Rule Collection: " RuleCollection ". Rule: " Rule
)

Great, we’ve fixed one panel, unfortunately there are more. I’ve shown the process I used to fix the queries, so you can go on and find the the other panels with the same issues and fix yourself, or just go ahead and import a fixed version of the workbook that I uploaded :)

https://github.com/dmc-tech/az-workbooks

Automating OMS Searches, Schedules, and Alerts in Azure Resource Manager Templates

OMS-Icon.png

Recently, I had an opportunity to produce a proof of concept around leveraging Operations Management Suite (OMS) as a centralized point of monitoring, analytics, and alerting.  As in any good Azure project, codifying your Azure resources in an Azure Resource Manager template should be table stakes. While the official ARM schema doesn't yet have all the children for the Microsoft.OperationalInsights/workspaces type, the Log Analytics documentation does document samples for interesting use cases that demonstrate data sources and saved searches.  Notably absent from this list, however, is anything about the /schedules and /action types. Now, a clever Azure Developer will realize that an ARM template is basically an orchestration and expression wrapper around the REST APIs.  In fact, I've yet to see a case where an ARM template supports a type that's not provided by those APIs.  With that knowledge and the alert API samples, we can adapt the armclient put <url> examples to an ARM template.

The Resources

What you see as an alert in the OMS portal is actually 2 to 3 distinct resources in the ARM model:

A mandatory schedules type, which defines the period and time window for the alert

{
  "name": "[concat(parameters('Workspace-Name'), '/', variables('Search-Name'), '/', variables('Schedule-Name'))]",
  "type": "Microsoft.OperationalInsights/workspaces/savedSearches/schedules",
  "apiVersion": "2015-03-20",
  "location": "[parameters('Workspace-Location')]",
  "dependsOn": [
    "[variables('Search-Id')]"
  ],
  "properties": {
    "Interval": 5,
    "QueryTimeSpan": 5,
    "Active": "true"
  }
}

A mandatory actions type, defining the trigger and email notification settings

{
  "name": "[concat(parameters('Workspace-Name'), '/', variables('Search-Name'), '/', variables('Schedule-Name'), '/', variables('Alert-Name'))]",
  "type": "Microsoft.OperationalInsights/workspaces/savedSearches/schedules/actions",
  "apiVersion": "2015-03-20",
  "location": "[parameters('Workspace-Location')]",
  "dependsOn": [
    "[variables('Schedule-Id')]"
  ],
  "properties": {
    "Type": "Alert",
    "Name": "[parameters('Search-DisplayName')]",
    "Threshold": {
      "Operator": "gt",
      "Value": 0
    },
    "Version": 1
  }
}

An optional, secondary, actions type, defining the alert's webhook settings

{
  "name": "[concat(parameters('Workspace-Name'), '/', variables('Search-Name'), '/', variables('Schedule-Name'), '/', variables('Action-Name'))]",
  "type": "Microsoft.OperationalInsights/workspaces/savedSearches/schedules/actions",
  "apiVersion": "2015-03-20",
  "location": "[parameters('Workspace-Location')]",
  "dependsOn": [
    "[variables('Schedule-Id')]"
  ],
  "properties": {
    "Type": "Webhook",
    "Name": "[variables('Action-Name')]",
    "WebhookUri": "[parameters('Action-Uri')]",
    "CustomPayload": "[parameters('Action-Payload')]",
    "Version": 1
  }
}

The Caveats

The full template adds a few eccentricities that are necessary for fully functioning resources.

First, let's talk about the search.  At the OMS interface, when you create a search, it is named <Category>|<Name> behind the scenes.  It is also lower-cased.  Now, the APIs will not downcase any name you send in, but if you use the interface to update that API-deployed search, you will duplicate it rather than being prompted to overwrite.  This tells us that for whatever reason, OMS' identifiers are case-sensitive.  This is why the template accepts a search category and name in parameters, then use variables to lower them and match the interface's naming convention.

Second, a schedule's name must be globally unique to your workspace, though the actions need not be.  Again, the OMS UI will take over here and generate GUIDs for the resources behind the scenes.  Unfortunately for us, ARM Templates don't support random number or GUID generation - a necessary evil of being deterministic.  While the template could accept a GUID by parameter, I find that asking my users for GUIDs is impolite - a uniquestring() function on the already-unique search name should suffice for most use cases.  Since the actions don't require uniqueness, static names will do.

Lastly, this template is not idempotent.  Idempotency is a characteristic of a desired state technology that focuses on ensuring the state (in our case, the template), rather than prescribing process (create this, update that, delete the other thing).  Each of Azure's types is responsible for ensuring that they implement idempotency as much as possible.  For some resources like the database extensions type, which imports .bacpac files, the entire type opts out of idempotency (once data is in the database, no more importing).  For others (such as Azure VMs), only changes in certain properties like administrator name/password break idempotency.  In the OMS search and schedule's case, if either one exists when you deploy the template, the deployment will fail with a code of BadRequest.  To add insult to injury, deleting the saved search from the interface does not delete the schedule.  Neither does deleting the alert from the UI - it simply flips the scheduled to "Enabled": false.  There is, in fact, no way to delete the schedule via the UI - you must do so via the REST API, similar to the following:

armclient delete /{Schedule ResourceID}?api-version=2015-03-20

This means that, for now, any versioned solution which desires to deploy ARM template updates to its searches and alerts will need to either:

  1. Delete the existing search/schedule, then redeploy OR
  2. Deploy the updated version side-by-side (named differently), then clean up the prior version's items.

Luckily ours was a POC, so deleting and re-creating was very much an option.  I look forward to days when search and alerting types become first-class, idempotent citizens.  Until then, I hope this approach proves useful!

The Template

The template below deploys a search, a schedule, a threshold action (the alert), and a webhook action (the action) that includes a custom JSON payload (remember to escape your JSON!).  With a little work, this template could be reworked to segregate the alert-specific components from the search so that multiple alerts could be deployed to the same search or adapted for use with Azure Automation Runbooks.  Enjoy!

{
  "$schema": "https://schema.management.azure.com/schemas/2015-01-01/deploymentTemplate.json#",
  "contentVersion": "1.0.0.0",
  "parameters": {
    "Action-Payload": {
      "type": "string"
    },
    "Action-Uri": {
      "type": "string"
    },
    "Alert-DisplayName": {
      "type": "string"
    },
    "Search-Category": {
      "type": "string"
    },
    "Search-DisplayName": {
      "type": "string"
    },
    "Search-Query": {
      "type": "string"
    },
    "Workspace-Name": {
      "type": "string"
    },
    "Workspace-Location": {
      "type": "string"
    }
  },
  "variables": {
    "Action-Name": "webhook",
    "Alert-Name": "alert",
    "Schedule-Name": "[uniquestring(variables('Search-Name'))]",
    "Search-Name": "[toLower(concat(variables('Search-Category'), '|', parameters('Search-DisplayName')))]",
    "Search-Id": "[resourceId('Microsoft.OperationalInsights/workspaces/savedSearches', parameters('Workspace-Name'), variables('Search-Name'))]",
    "Schedule-Id": "[resourceId('Microsoft.OperationalInsights/workspaces/savedSearches/schedules', parameters('Workspace-Name'), variables('Search-Name'), variables('Schedule-Name'))]",
    "Alert-Id": "[resourceId('Microsoft.OperationalInsights/workspaces/savedSearches/schedules/actions', parameters('Workspace-Name'), variables('Search-Name'), variables('Schedule-Name'), variables('Alert-Name'))]",
    "Action-Id": "[resourceId('Microsoft.OperationalInsights/workspaces/savedSearches/schedules/actions', parameters('Workspace-Name'), variables('Search-Name'), variables('Schedule-Name'), variables('Action-Name'))]"
  },
  "resources": [
    {
      "name": "[concat(parameters('Workspace-Name'), '/', variables('Search-Name'))]",
      "type": "Microsoft.OperationalInsights/workspaces/savedSearches",
      "apiVersion": "2015-03-20",
      "location": "[parameters('Workspace-Location')]",
      "dependsOn": [],
      "properties": {
        "Category": "[parameters('Search-Category')]",
        "DisplayName": "[parameters('Search-DisplayName')]",
        "Query": "[parameters('Search-Query')]",
        "Version": "1"
      }
    },
    {
      "name": "[concat(parameters('Workspace-Name'), '/', variables('Search-Name'), '/', variables('Schedule-Name'))]",
      "type": "Microsoft.OperationalInsights/workspaces/savedSearches/schedules",
      "apiVersion": "2015-03-20",
      "location": "[parameters('Workspace-Location')]",
      "dependsOn": [
        "[variables('Search-Id')]"
      ],
      "properties": {
        "Interval": 5,
        "QueryTimeSpan": 5,
        "Active": "true"
      }
    },
    {
      "name": "[concat(parameters('Workspace-Name'), '/', variables('Search-Name'), '/', variables('Schedule-Name'), '/', variables('Alert-Name'))]",
      "type": "Microsoft.OperationalInsights/workspaces/savedSearches/schedules/actions",
      "apiVersion": "2015-03-20",
      "location": "[parameters('Workspace-Location')]",
      "dependsOn": [
        "[variables('Schedule-Id')]"
      ],
      "properties": {
        "Type": "Alert",
        "Name": "[parameters('Search-DisplayName')]",
        "Threshold": {
          "Operator": "gt",
          "Value": 0
        },
        "Version": 1
      }
    },
    {
      "name": "[concat(parameters('Workspace-Name'), '/', variables('Search-Name'), '/', variables('Schedule-Name'), '/', variables('Action-Name'))]",
      "type": "Microsoft.OperationalInsights/workspaces/savedSearches/schedules/actions",
      "apiVersion": "2015-03-20",
      "location": "[parameters('Workspace-Location')]",
      "dependsOn": [
        "[variables('Schedule-Id')]"
      ],
      "properties": {
        "Type": "Webhook",
        "Name": "[variables('Action-Name')]",
        "WebhookUri": "[parameters('Action-Uri')]",
        "CustomPayload": "[parameters('Action-Payload')]",
        "Version": 1
      }
    }
  ],
  "outputs": {}
}

Writing your own custom data collection for OMS using SCOM Management Packs

OMS-Cover-Photo.png

[Unsupported] OMS is a great data collection and analytics tool, but at the moment it also has some limitations. Microsoft has been releasing Integration Pack after Integration Pack and adding features at a decent pace, but unlike the equivalent SCOM Management Packs the IPs are somewhat of a black box. Awhile back, I got frustrated with some of the lack of configuration options in OMS (then Op Insights) and decided to “can opener” some of the features. I figured the best way to do this was to examine some of the management packs that OMS would install into a connected SCOM Management Group and start digging through their contents. Now granted, lately the OMS team has added a lot more customization options than they used to have when I originally traced this out. You can now add custom performance collection rules, custom log collections, and more all from within the OMS portal itself. However, there are still several advantages to being able create your own OMS collection rules in SCOM directly. These include:

  • Additional levels of configuration customization beyond what’s offered in the OMS portal, such as the ability to target any class you want or use more granular filter criteria than is offered by the portal.

  • The ability to migrate your collection configuration from one SCOM instance to another. OMS doesn’t currently allow you to export custom configuration.

  • The ability to do bulk edits through the myriad of tools and editors available for SCOM management packs (it’s much easier to add 50 collection rules to an existing SCOM MP using a simple RegEx find/replace than it is to hand enter them into the OMS SaaS portal).

Digging into the Management Packs automatically loaded into a connected SCOM instance from OMS, we find that there are quite a few. A lot of them still bear the old “System Center Advisor” filenames and display strings from before Advisor got absorbed into OMS, but the IPs also add in a bunch of new MPs that include “IntelligencePacks” in the IDs making them easier to filter by. Many of the type definitions are  stored in a pack named (unsurprisingly) Microsoft.IntelligencePacks.Types.

Here is the Event Collection Write Action Module Type Definition:

Event Collector Type

Now let’s take a look at one of the custom event collection rules I created in the OMS portal to grab all Application log events. These rules are contained in the Microsoft.IntelligencePack.LogManagement.Collection MP:

Application Log Collection Rule

We can see that the event collection rule for OMS looks an awful lot like a normal event collection rule in SCOM. The ID is automatically generated according to a naming convention that OMS keeps track of  which is Microsoft.IntelligencePack.LogManagement.Collection.EventLog. followed by a unique ID string to identify to OMS each specific rule. The only real difference between this rule and a standard event collection rule is the write action, which is the custom write action we saw defined in the Types pack that’s designed to write the event to OMS instead of to the SCOM Data Warehouse. So all you need to do to create your own custom event data collection rule in SCOM is add a reference to the Type MP to your custom MP like:

<Reference Alias="IPTypes"> <ID>Microsoft.IntelligencePacks.Types</ID> <Version>7.0.9014.0</Version> <PublicKeyToken>31bf3856ad364e35</PublicKeyToken> </Reference>

…and then either replace the write action in a standard event collection rule with the following, or add it as an additional write action (you can actually collect to both databases using a single rule):

<WriteAction ID="HttpWA" TypeID="IPTypes!Microsoft.SystemCenter.CollectCloudGenericEvent" />

Now granted, OMS lets you create your own custom event log collection rules using the OMS portal, but at the moment the level of customization and filtering available in the OMS portal is pretty limited. You can specify the name of the log and you can select any combination of three event levels (ERROR, WARNING, and INFOMRATION). You can modify the collection rules to filter them down based on any additional criteria you can create using a standard SCOM management pack. In large enterprises, this can help keep your OMS consumption costs down by leaving out events that you know you do not need to collect.

If we look at Performance Data next, we see that there are two custom Write Action types that are of interest to us:

Perf Data Collector Type

…and…

Perf Agg Data Collector Type

…which are the Write Action Modules used for collecting custom performance data and the aggregates for that performance data, respectively. If we take a look at some of the performance collection rules that use these types, we can see how we can use them ourselves. Surprisingly, in the current iteration of OMS they get stored in the Microsoft.IntelligencePack.LogManagement.Collection MP along with the event log collection rules. Here’s an example of the normal collection rule generated in SCOM by adding a rule in OMS:

Perf Data Collector Rule

And just like what we saw with the Event Collection rules, the only difference between this rule and a normal SCOM Performance Collection rule is that instead of the write action to write the data to the Operations Manager DB or DW, we have a “write to cloud” Write Action. So all we need to do in order to add OMS performance collection to existing performance rules is add a reference to the Types MP:

<Reference Alias="IPTypes"> <ID>Microsoft.IntelligencePacks.Types</ID> <Version>7.0.9014.0</Version> <PublicKeyToken>31bf3856ad364e35</PublicKeyToken> </Reference>

And then add the custom write action to the Write Actions section of any of our existing collection rules. Like with the Event Collection rules, we can use multiple write actions so a single rule is capable of writing to Operations Manager database, the data warehouse, and OMS.

<WriteAction ID="WriteToCloud" TypeID="IPTypes!Microsoft.SystemCenter.CollectCloudPerformanceData_PerfIP" />

Now in addition to the standard collection rule we also have an aggregate collection rule that looks like this:

App Log Agg Collection Rule

This rule looks almost exactly like the previous collection rule, except for two big differences. One, is that it uses a different write action:

<ConditionDetection ID="Aggregator" TypeID="IPPerfCollection!Microsoft.IntelligencePacks.Performance.PerformanceAggregator">

…and there is an additional Condition Detection that wasn’t present in the standard collection rule for the aggregation:

<ConditionDetection ID="Aggregator" TypeID="IPPerfCollection!Microsoft.IntelligencePacks.Performance.PerformanceAggregator"> <AggregationIntervalInMinutes>30</AggregationIntervalInMinutes> <SamplingIntervalSeconds>10</SamplingIntervalSeconds> </ConditionDetection>

Changing the value for AggregationIntervalInMinutes allows you to change the aggregation interval, which is something that you cannot do in the OMS portal. Otherwise, the native Custom Performance Collection feature of OMS is pretty flexible and allows you to use any Object/Counter/Instance combination you want. However, if your organization already uses SCOM there’s a good chance that you already have a set of custom SCOM MPs that you use for performance data collection. Adding a single write action to these existing rules and creating an additional optional aggregation rule for 100 pre-existing rules is likely easier for an experienced SCOM author than hand-entering 100 custom performance collection rules into the OMS portal. The other benefits from doing it this way include the ability to bulk edit (changing the threshold for all the counters, for example, would be a simple find/replace instead manually changing each rule) and the ability to export this configuration. OMS lets you export data, but not configuration. Any time you spend hand-entering data into the OMS portal would have to be repeated for any other OMS workspace you want to use that configuration in. A custom SCOM MP, however, can be put into source control and re-used in as many different environments as you like.

Note: When making modifications to any rules, do not make changes to the unsealed OMS managed MPs in SCOM. While these changes probably won’t break anything, OMS is the source of record for the content of those MPs. If you make a change in SCOM, it will be disconnected from the OMS config and will likely be overwritten the next time you make a change in OMS.

One last thing. Observant readers may have noticed that every rule I posted is disabled by default. OMS does this for every custom rule, and then enables the rules through the use of an override that’s contained within the same unsealed management pack so this is normal. This is presumably because adjusting an override to enable/disable something is generally considered a “lighter” touch than editing a rule directly, although I don’t see any options to disable any of the collection rules (only delete them).